Quasi-Experiments
POLSCI 4SS3
Winter 2024
Announcements
Decide if you will sign up for final project by April 4
Instructor traveling April 3-7
What did you learn this semester?
Where to go from here?
Go back to foundations
- Probability and statistics
- Philosophy of science
- Research design
- R programming
Where to go from here?
Further learning
- Programming in Python, Julia
- Survey design
- Program evaluation
- Science of science
Where to go from here?
Careers & fields
Data science, computer science, statistics
Computational/quantitative social science
Econometrics
Evidence-informed policy
Public administration
Business, marketing
Quasi-experiments
Data strategies
Data strategy
|
||
|---|---|---|
| Inquiry | Observational | Experimental |
| Descriptive | Sample survey | List experiment |
| Causal | Quasi-experiment | Survey/field experiment |
Data strategies
Data strategy
|
||
|---|---|---|
| Inquiry | Observational | Experimental |
| Descriptive | Sample survey | List experiment |
| Causal | Quasi-experiment | Survey/field experiment |
Challenges to causal interpretations
1. Reverse causation
Instead of \(Z\) causing \(Y\), \(Y\) causes \(Z\)
Simultaneity: \(Z\) causes \(Y\) and vice versa
Challenges to causal interpretations
1. Reverse causation
Instead of \(Z\) causing \(Y\), \(Y\) causes \(Z\)
Simultaneity: \(Z\) causes \(Y\) and vice versa
Example
Students who are likely to participate enroll in Political Science courses more often
Challenges to causal interpretations
2. Omitted variable bias
Challenges to causal interpretations
2. Omitted variable bias
- There is an unobserved factor \(X\) that explains the relationship between \(Z\) and \(Y\)
Challenges to causal interpretations
2. Omitted variable bias
- There is an unobserved factor \(X\) that explains the relationship between \(Z\) and \(Y\)
Example
We believe that more education increases income
But having smart parents increases both education and income
Challenges to causal interpretations
3. Selection bias
Individuals sort into condition \(Z\) in a manner that predicts outcome \(Y\)
Treatment and control are not comparable
Challenges to causal interpretations
3. Selection bias
Individuals sort into condition \(Z\) in a manner that predicts outcome \(Y\)
Treatment and control are not comparable
Example
- Always-takers are more likely to participate in the TUP program
Challenges to causal interpretations
1. Reverse causation
2. Omitted variable bias
3. Selection bias
Random assignment avoids this in expectation
Hard to overcome with observational causal data strategies
Need to pretend that we can analyze data as if it was an experiment
Quasi-experiments
Answer strategies that produce data as-if they were drawn from an experiment
Natural experiment: Random assignment outside of the researcher control
Example: Choosing municipalities at random for auditing
Quasi-experiment: Conditions are assigned in a manner that is sufficiently orthogonal to potential outcomes
Regression Discontinuity
Hoekstra (2019)
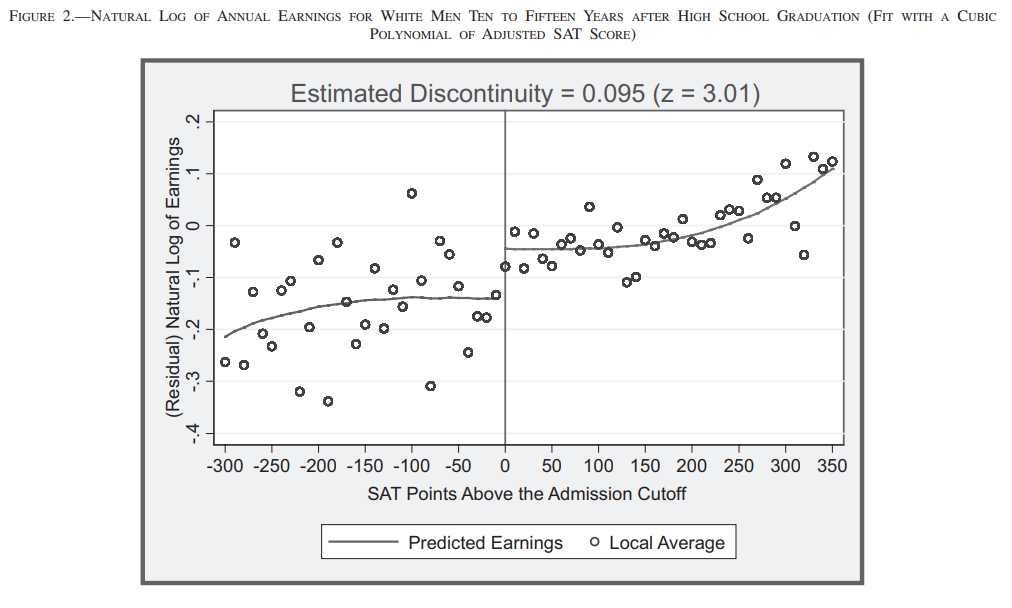
Treatment take-up
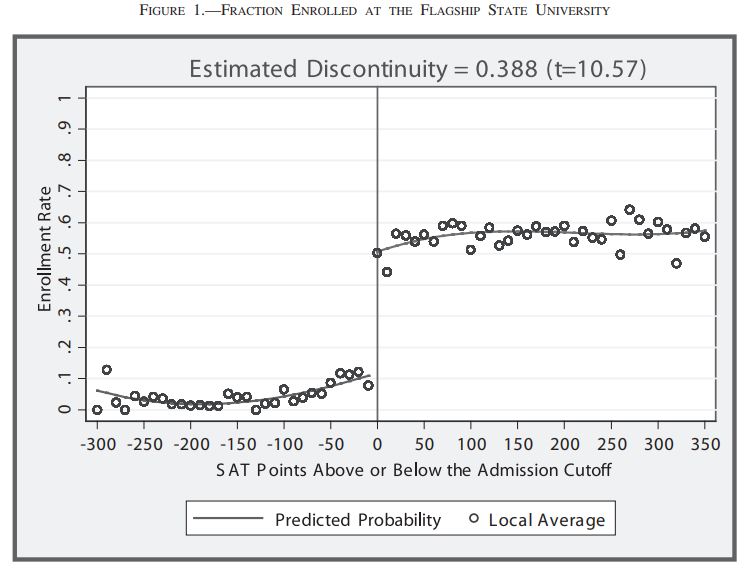
Regression discontinuity designs
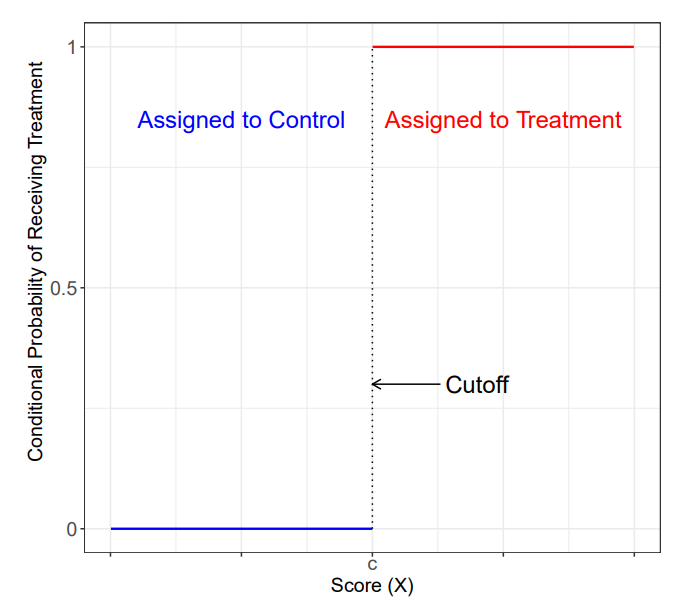
- Three ingredients:
Score
(running variable)Cutoff
(threshold)Treatment
(at least two conditions)
Visual representation
How do you get an estimate?
- Two approaches to RDD data:
Local randomization
Continuity-based
Local randomization
Potential outcomes are not random because they depend on the score
(and other things)However, around the cutoff, treatment assignment is as good as random
Example: Barely winning an election
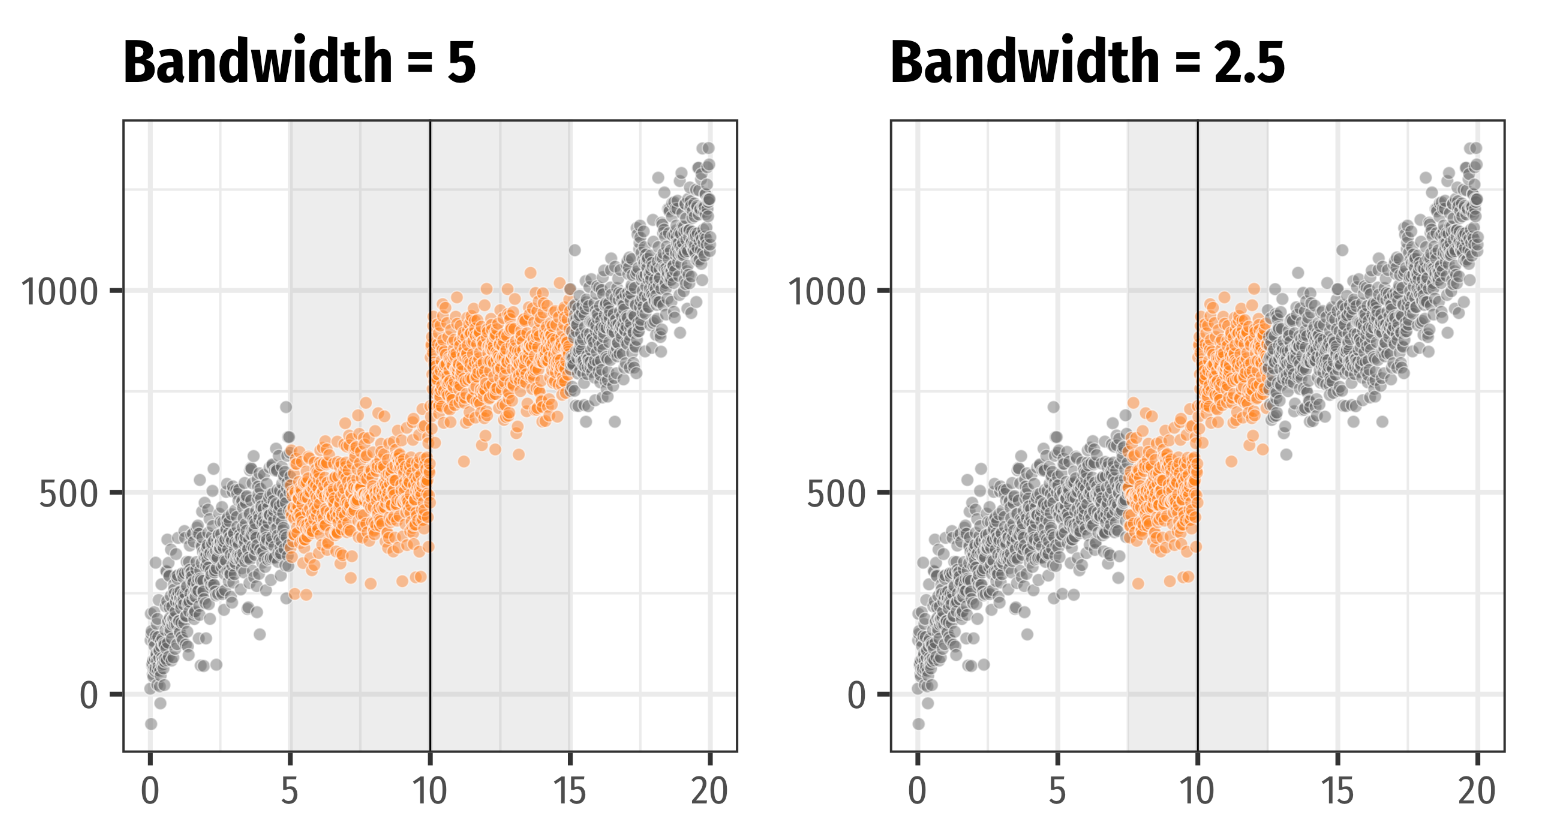
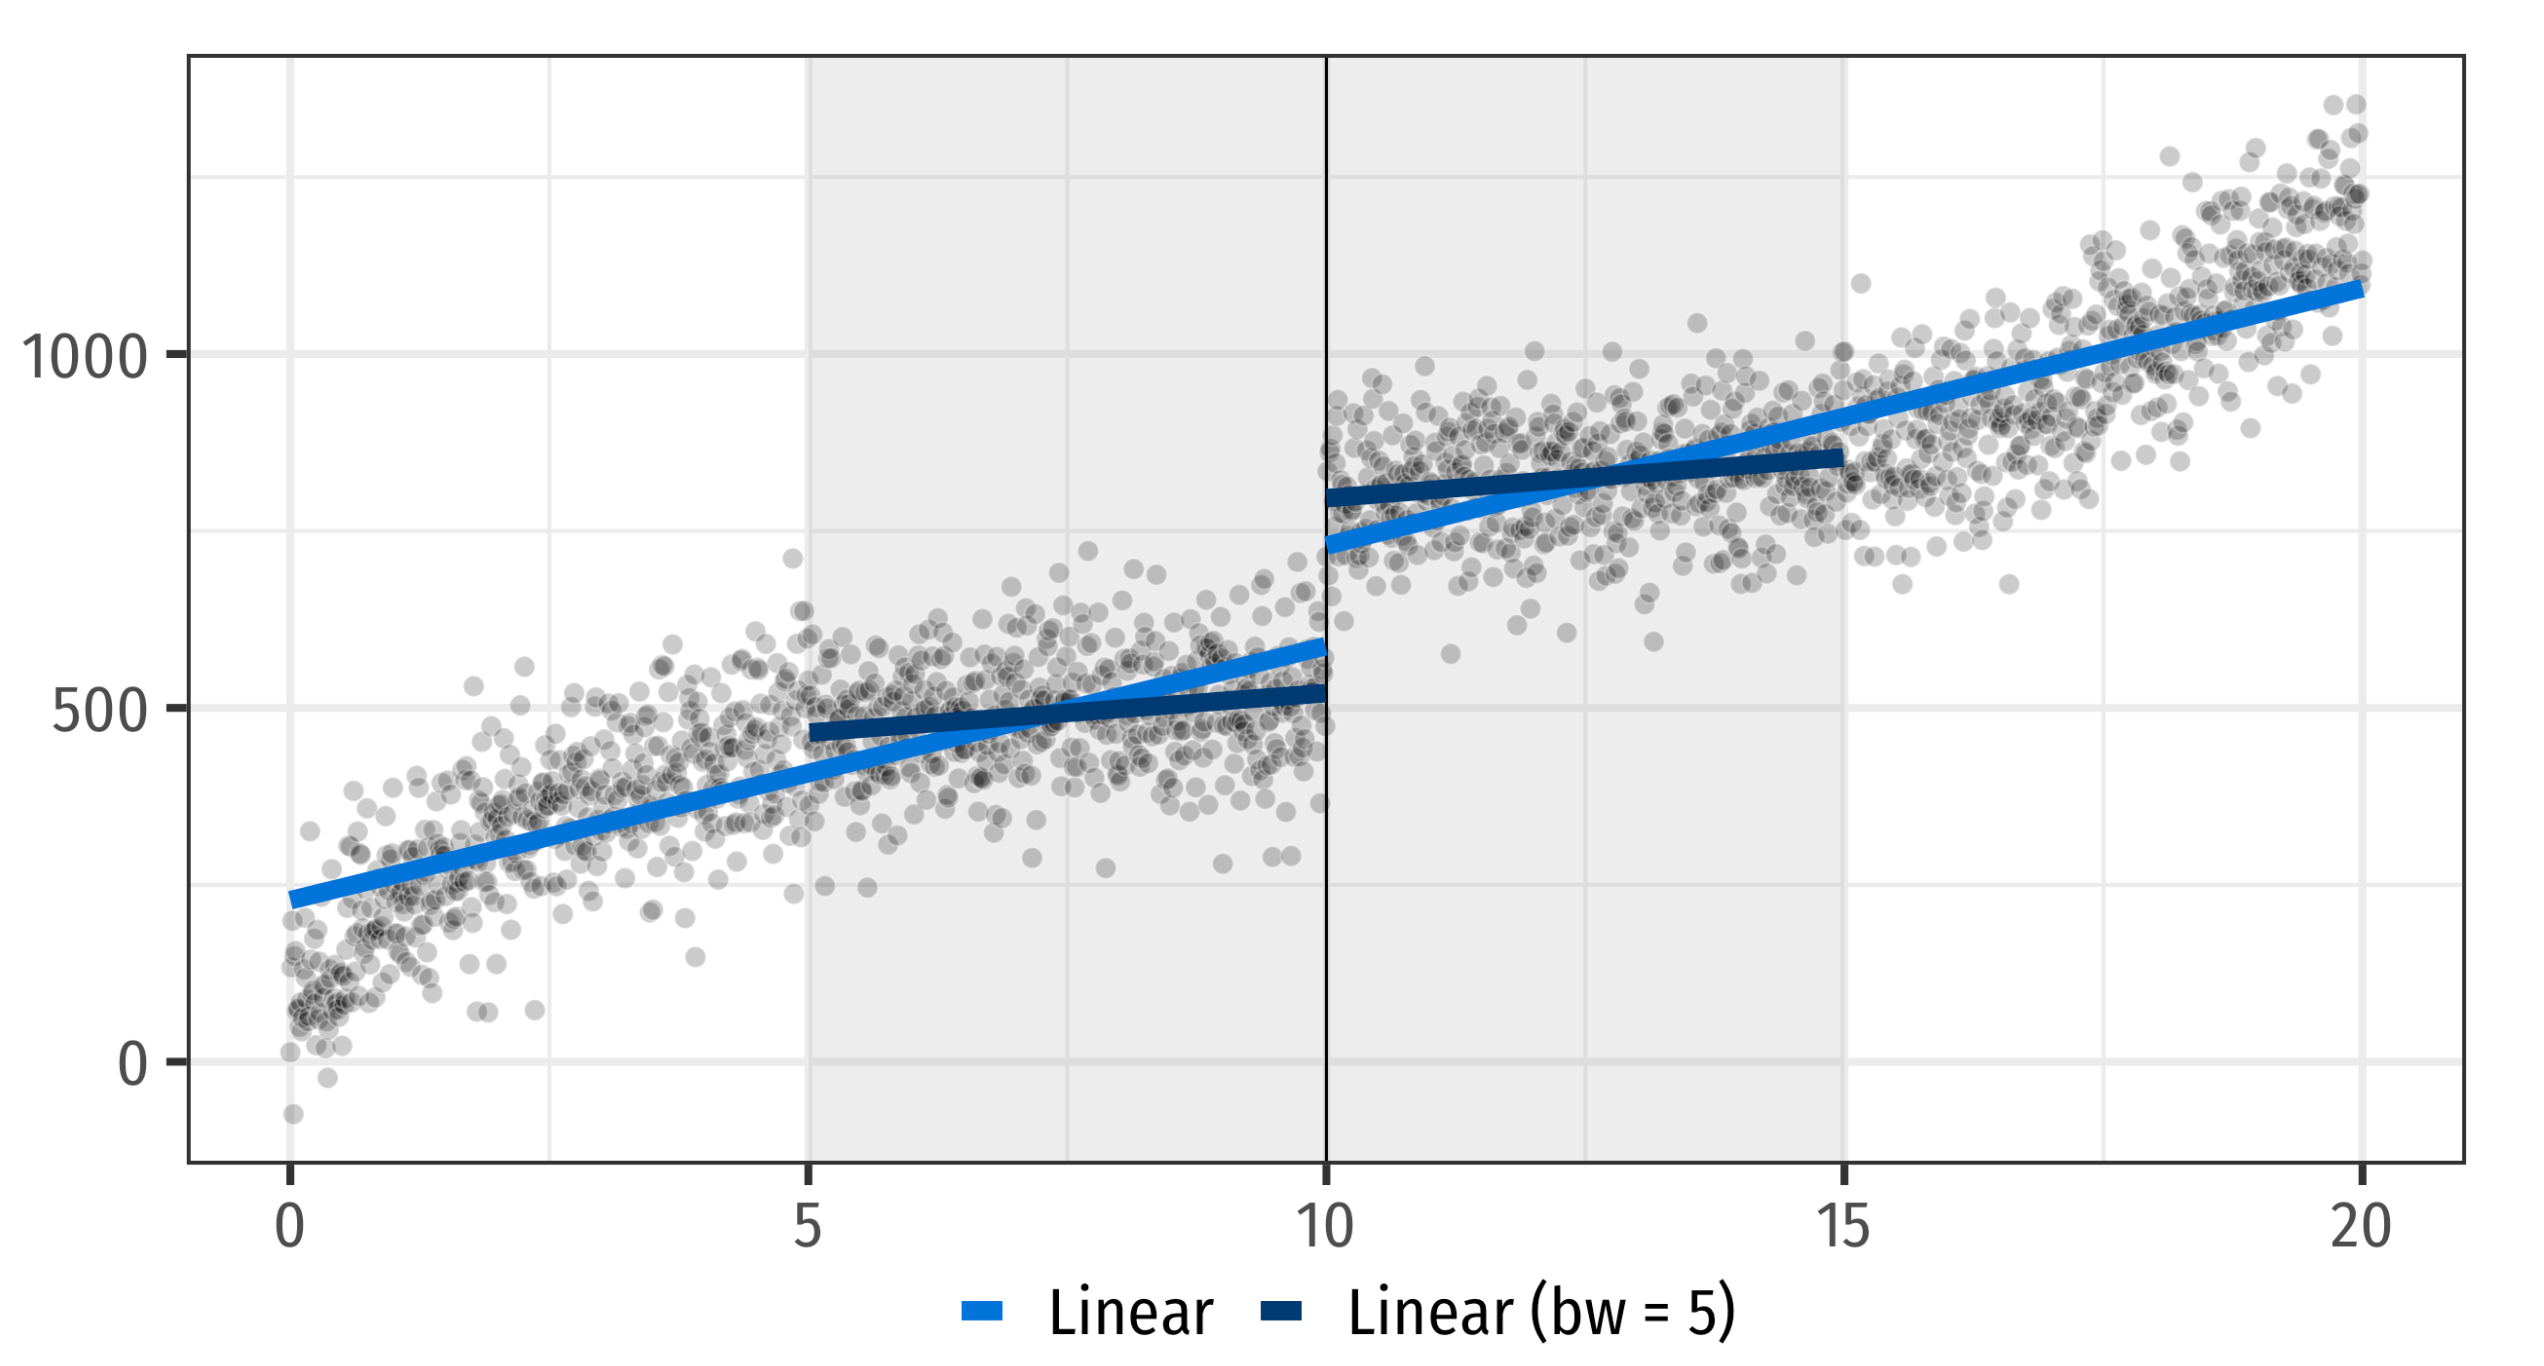
So we can pretend we have an experiment within a bandwidth around the cutoff
Bandwidth tradeoff
Continuity-based approach
Treatment assignment is deterministic at the cutoff
Example: Financial aid if income below a threshold
But usually too few or no units at the cutoff
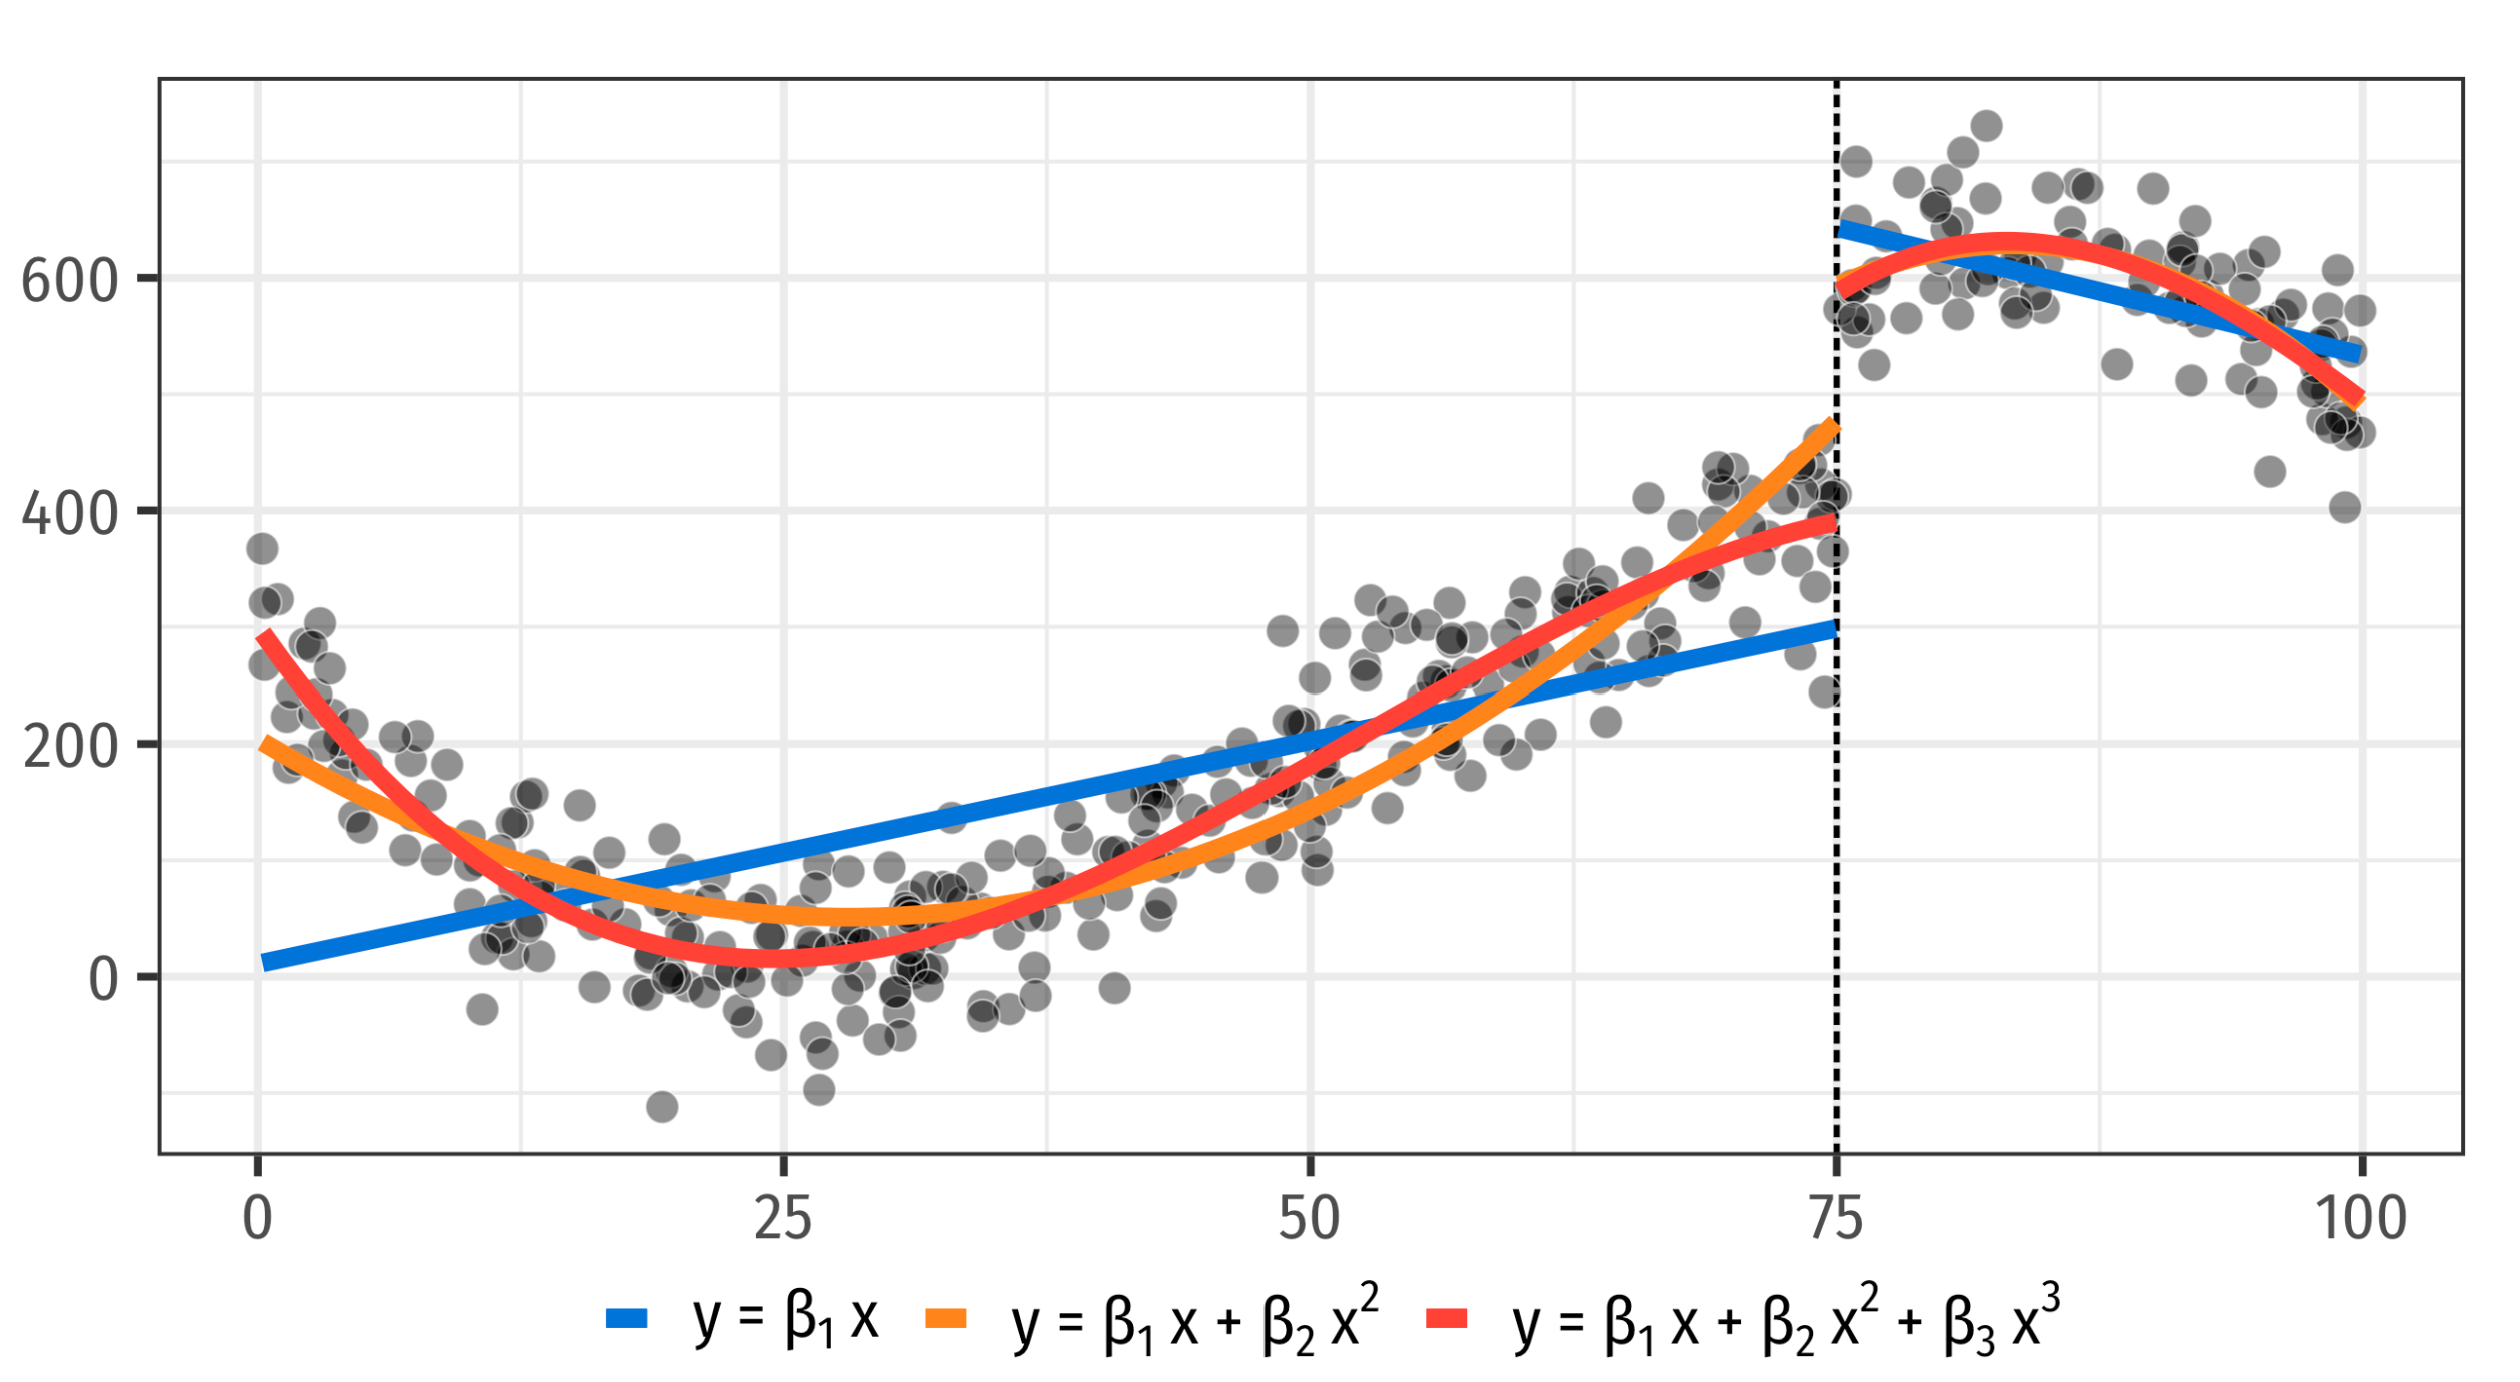
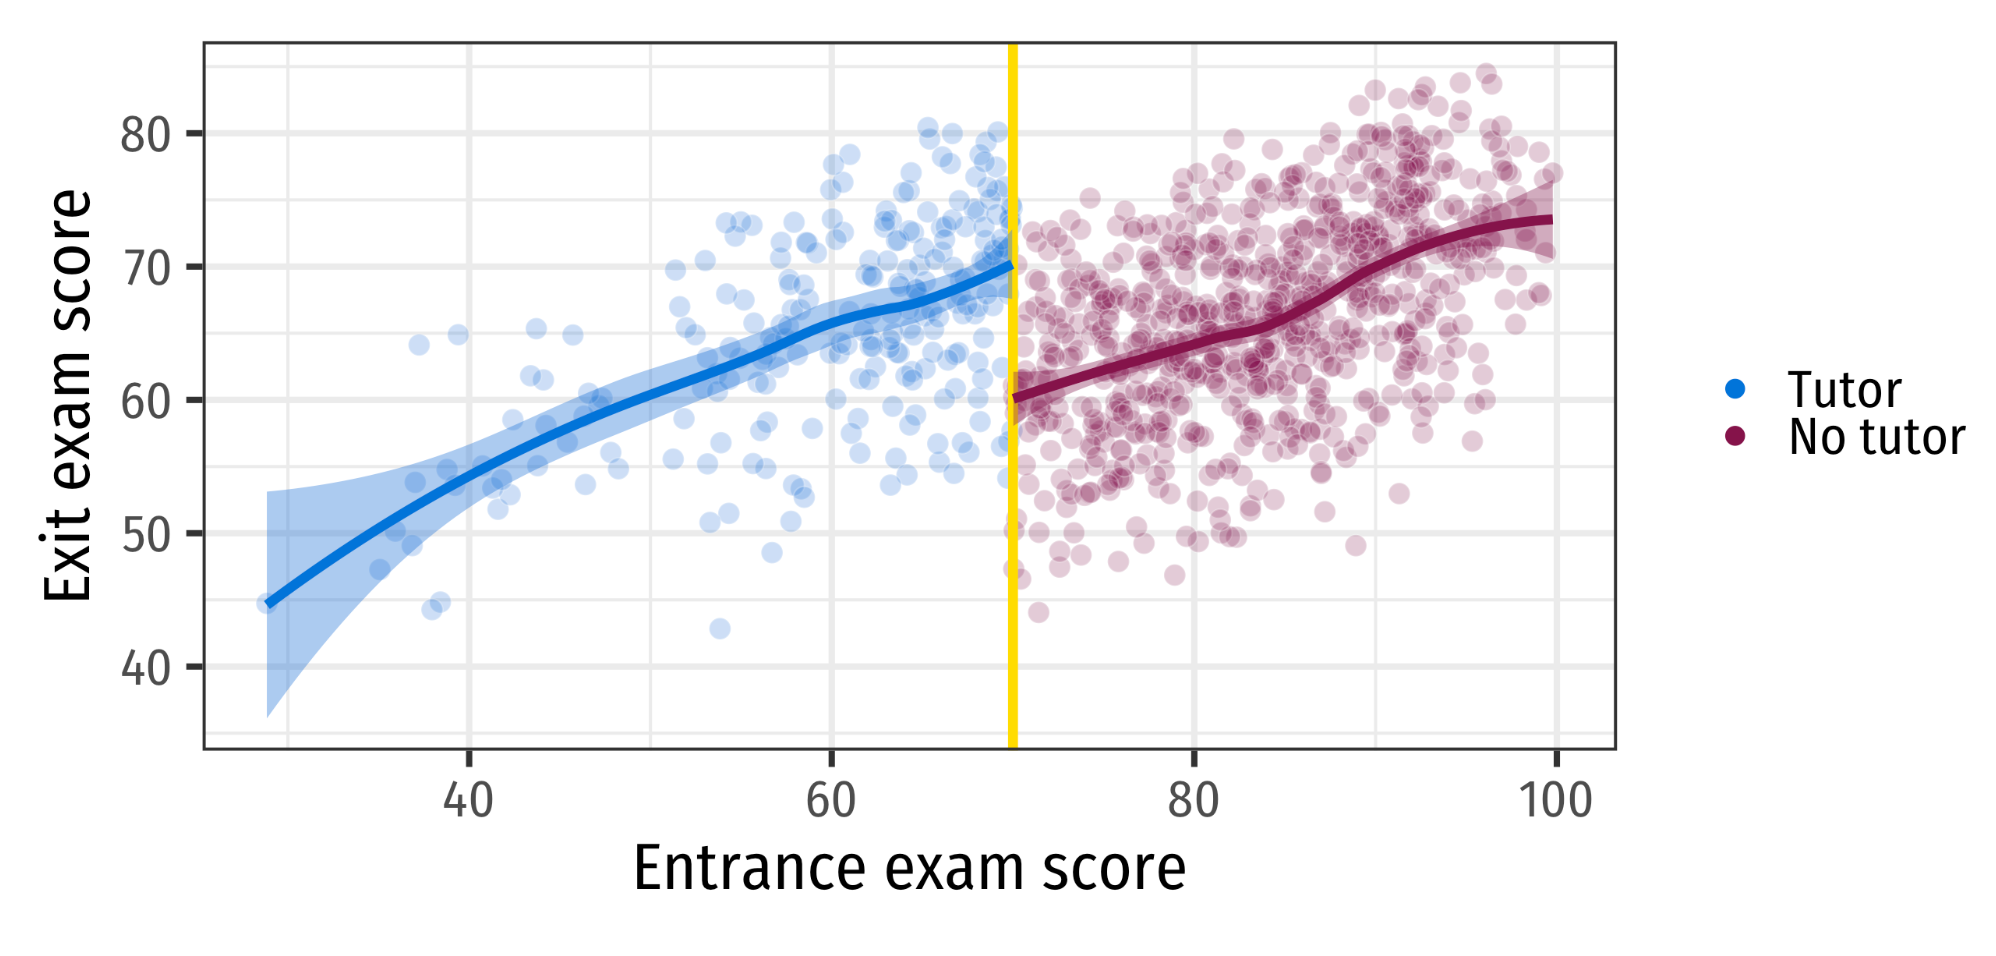
Task: Approximate the gap at the cutoff as best as possible
This becomes a line drawing problem
Line drawing: Parametric
Line drawing: Nonparametric
Line drawing: Bandwidth
Difference-in-differences
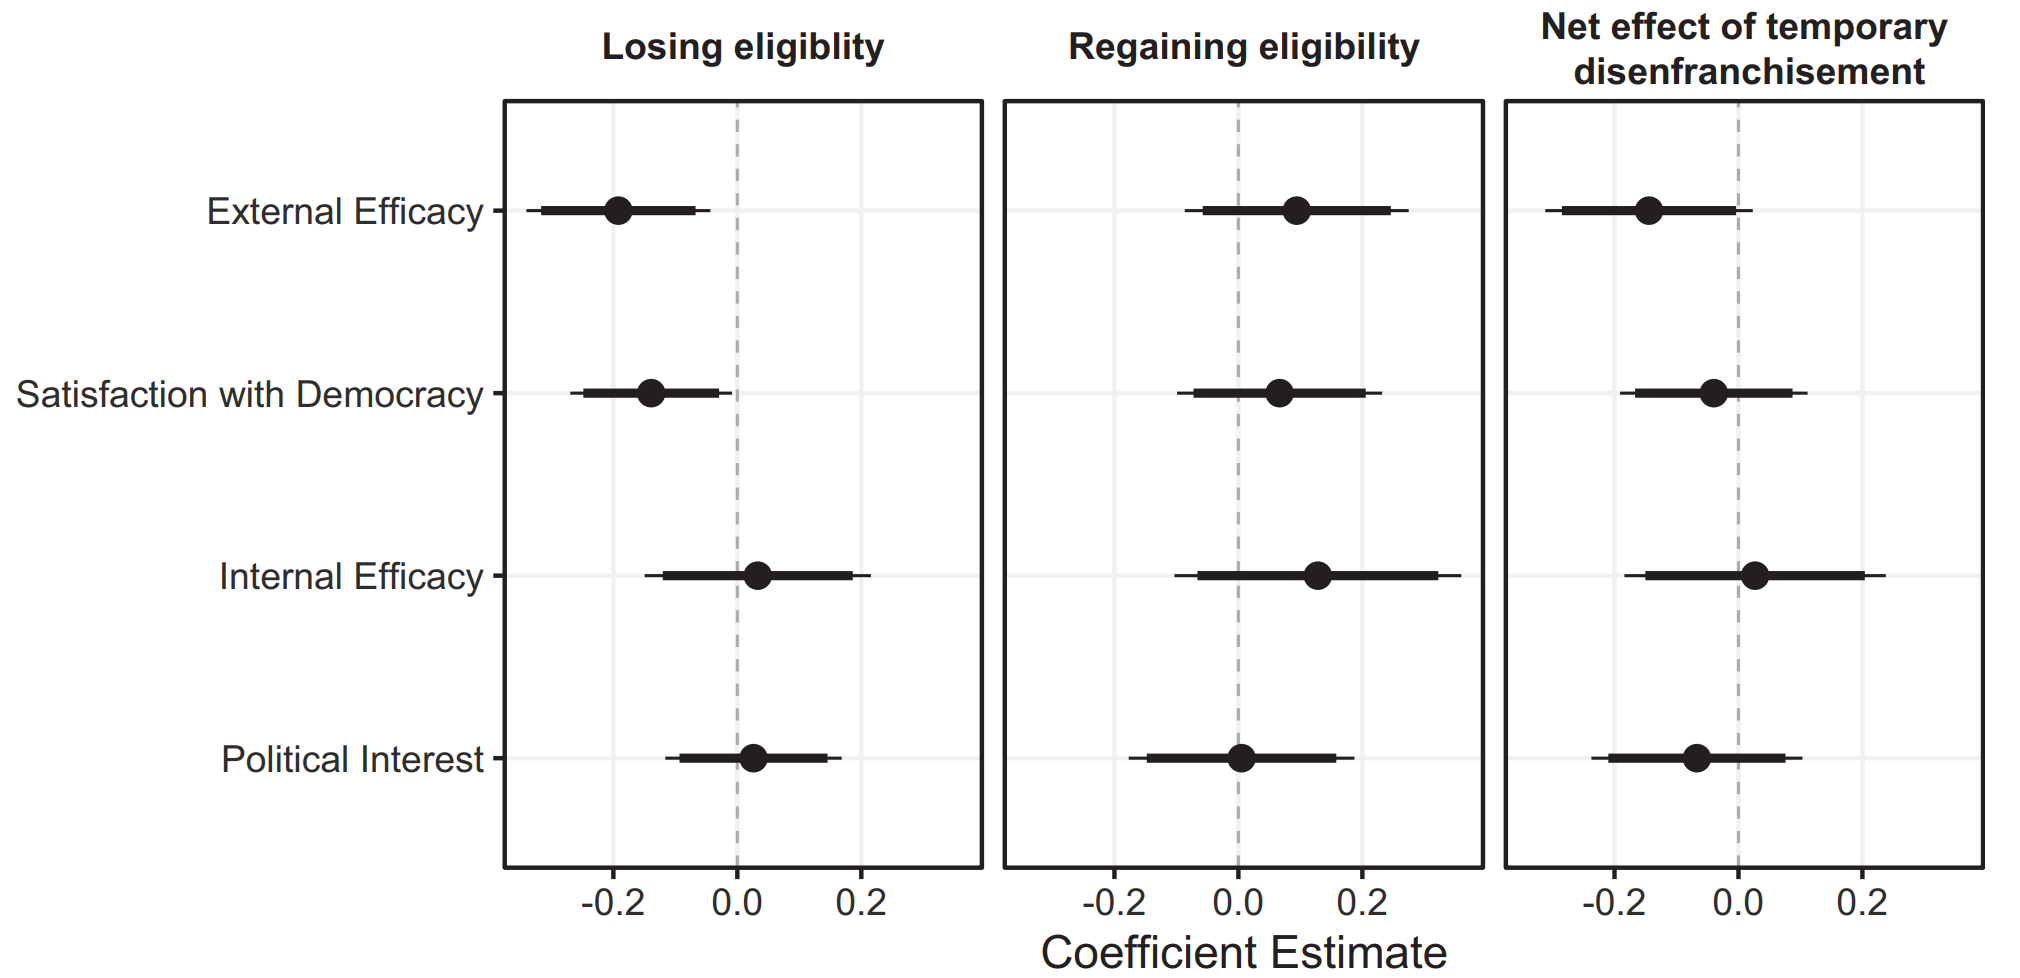
Leininger et al (2023)

- Temporary disenfranchisement may push voters away from democracy
- Outcomes: Survey questions about internal/external efficacy, satisfaction with democracy, political interest
Comparisons

Results
Difference-in-differences design
At least two groups or conditions
(treatment,control)At least two time periods
(pre- and post-treatment)Once treated, units stay on
We accept that selection bias is unavoidable
But comparing before-after changes between groups allows us to calculate treatment effect
Diff-in-diffs estimator
Timing
|
||
|---|---|---|
| Group | Before | After |
| Treatment | A | B |
| Control | C | D |
\[ \widehat{ATE} = [\text{Mean}(B) - \text{Mean}(A)] - [\text{Mean}(D) - \text{Mean}(C)] \]
Diff-in-diffs estimator
Timing
|
||
|---|---|---|
| Group | Before | After |
| Treatment | A | B |
| Control | C | D |
\[ \widehat{ATE} = \underbrace{[\text{Mean}(B) - \text{Mean}(A)]}_\text{Difference} - \underbrace{[\text{Mean}(D) - \text{Mean}(C)]}_\text{Difference} \]
Diff-in-diffs estimator
Timing
|
||
|---|---|---|
| Group | Before | After |
| Treatment | A | B |
| Control | C | D |
\[ \widehat{ATE} = \underbrace{\underbrace{[\text{Mean}(B) - \text{Mean}(A)]}_\text{Difference} - \underbrace{[\text{Mean}(D) - \text{Mean}(C)]}_\text{Difference}}_\text{Difference in differences} \]
Assumption: Parallel trends
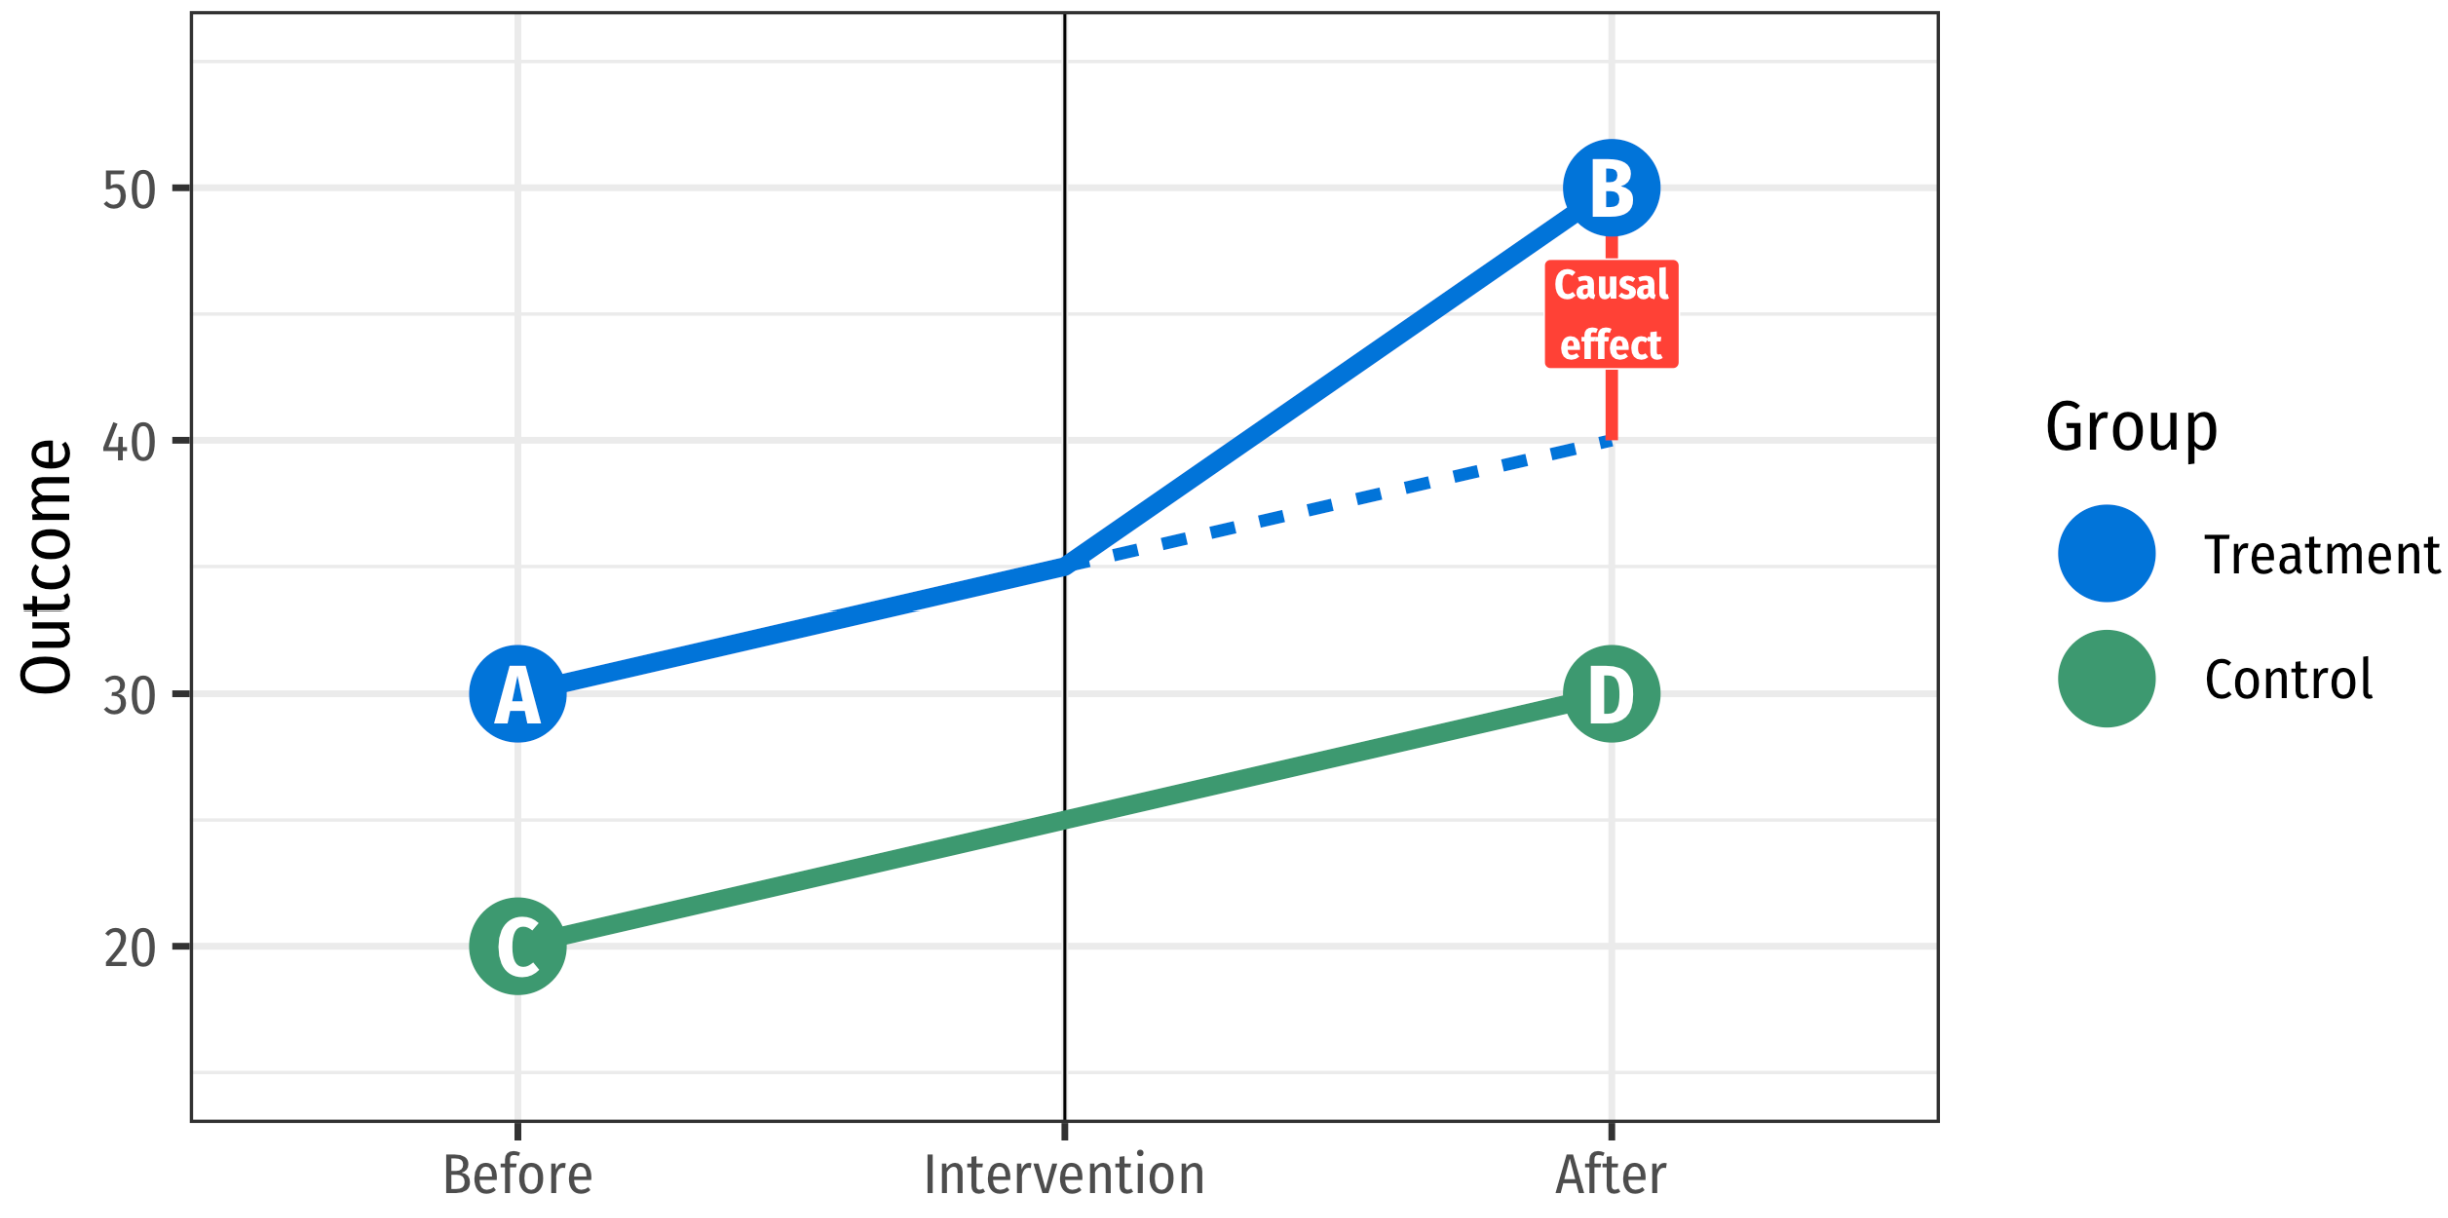
What happens if we break parallel trends?
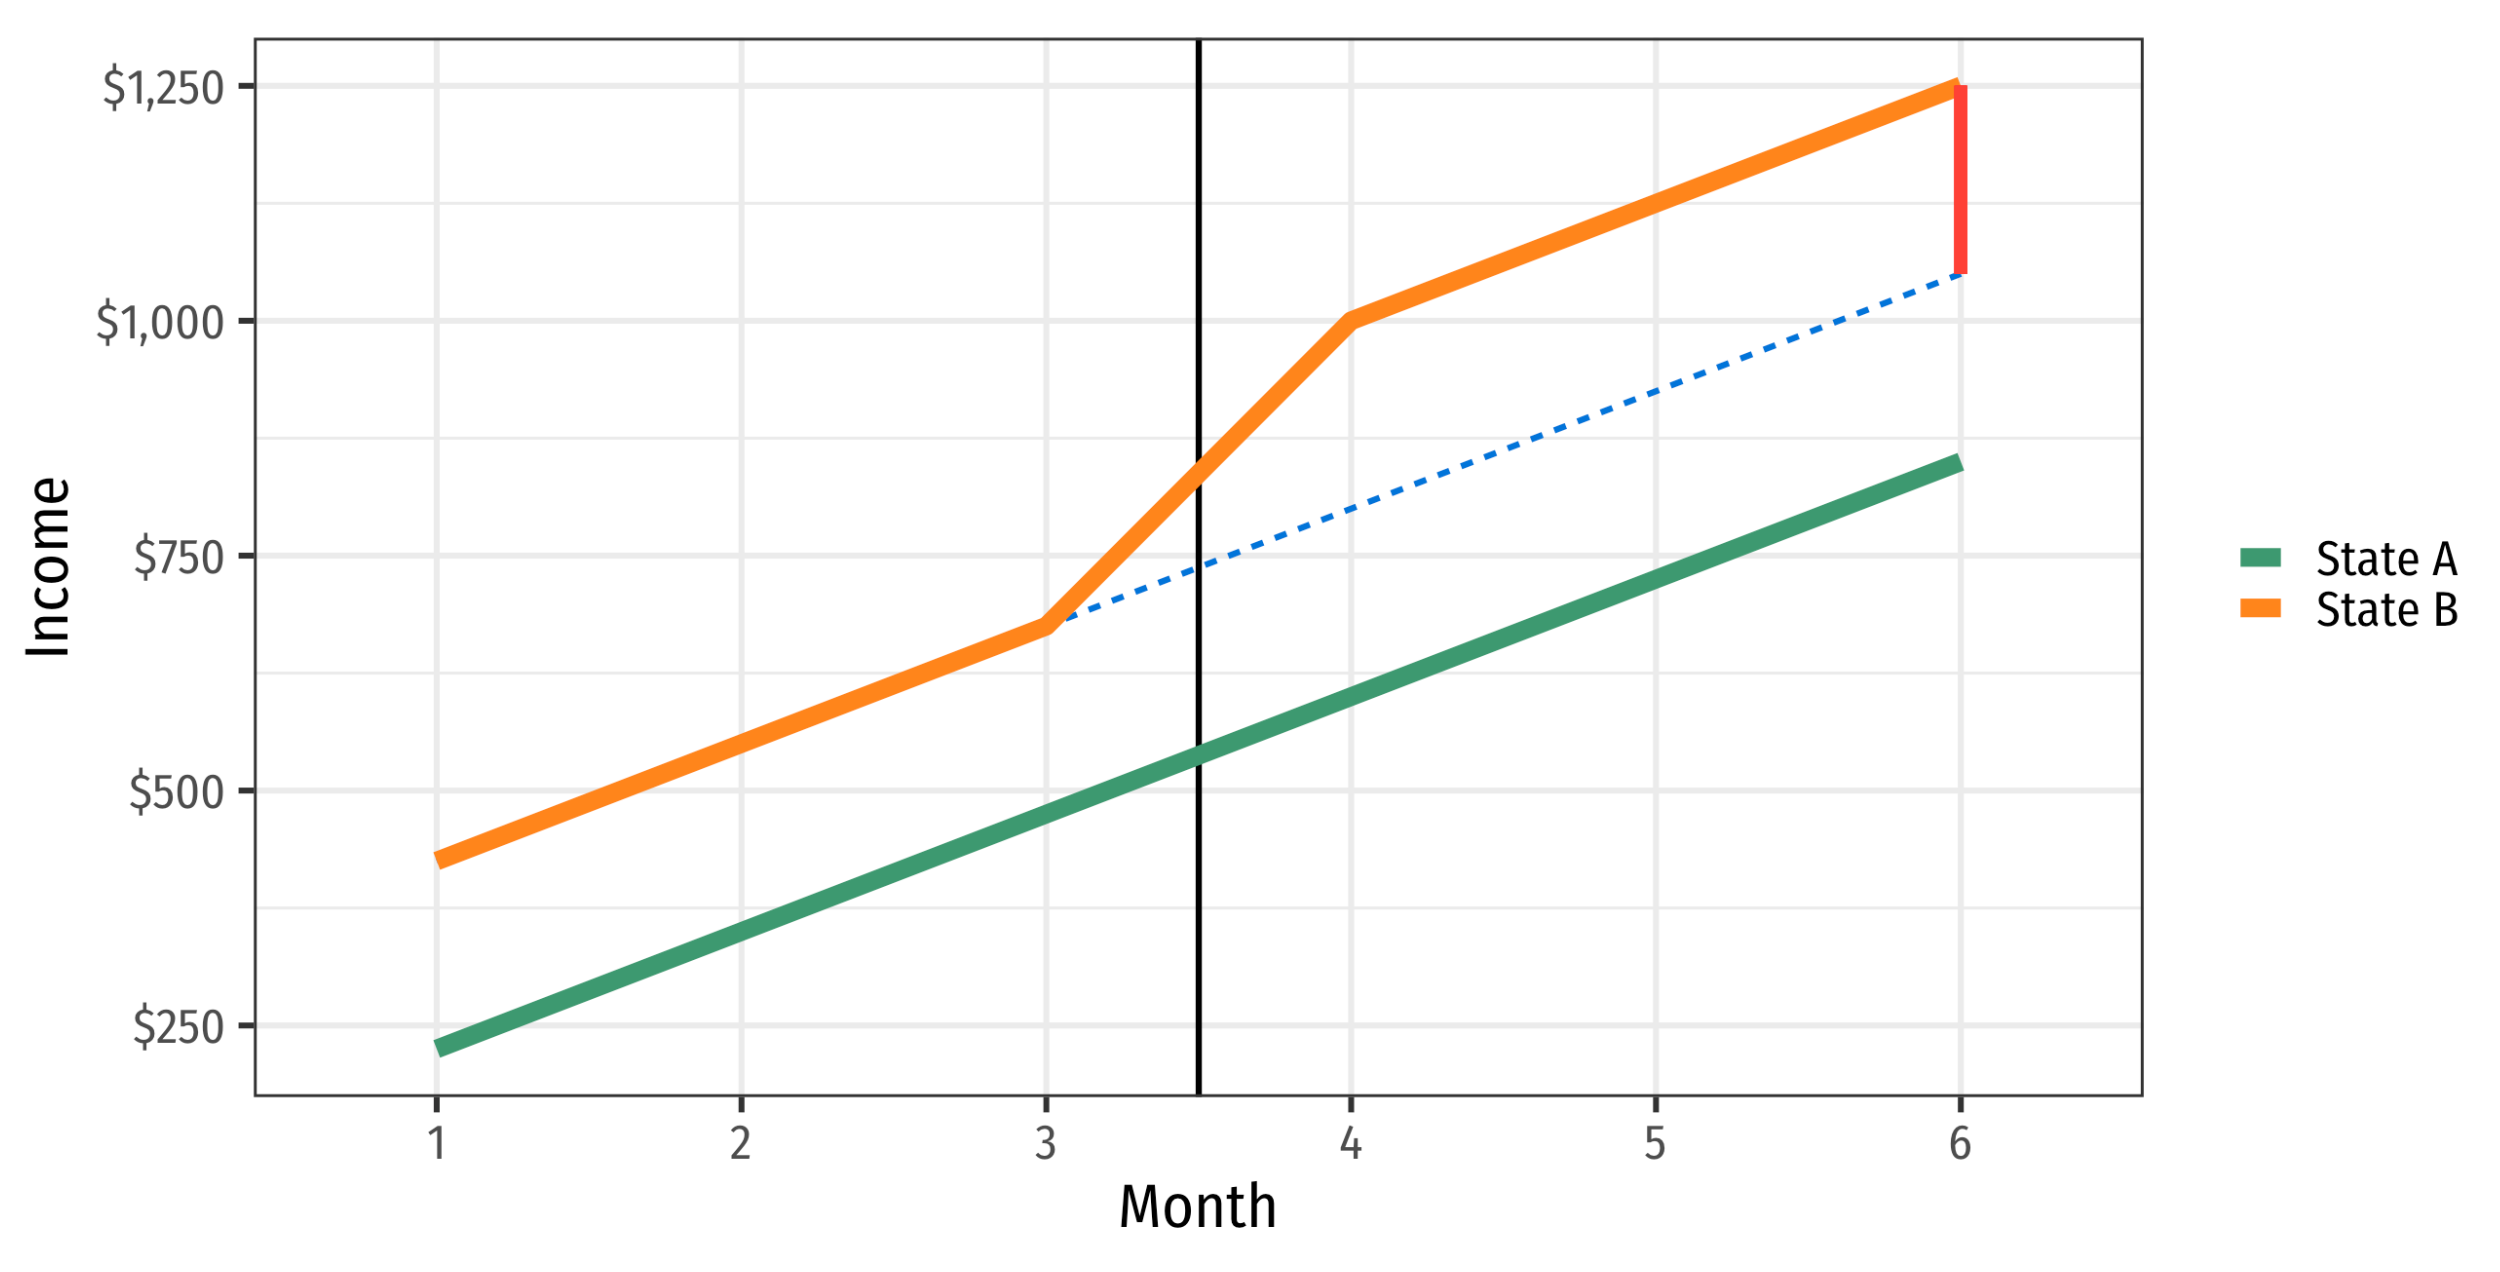
What happens if we break parallel trends?

What happens if we break parallel trends?

Thank you!
Break time!
